 Enes Guven
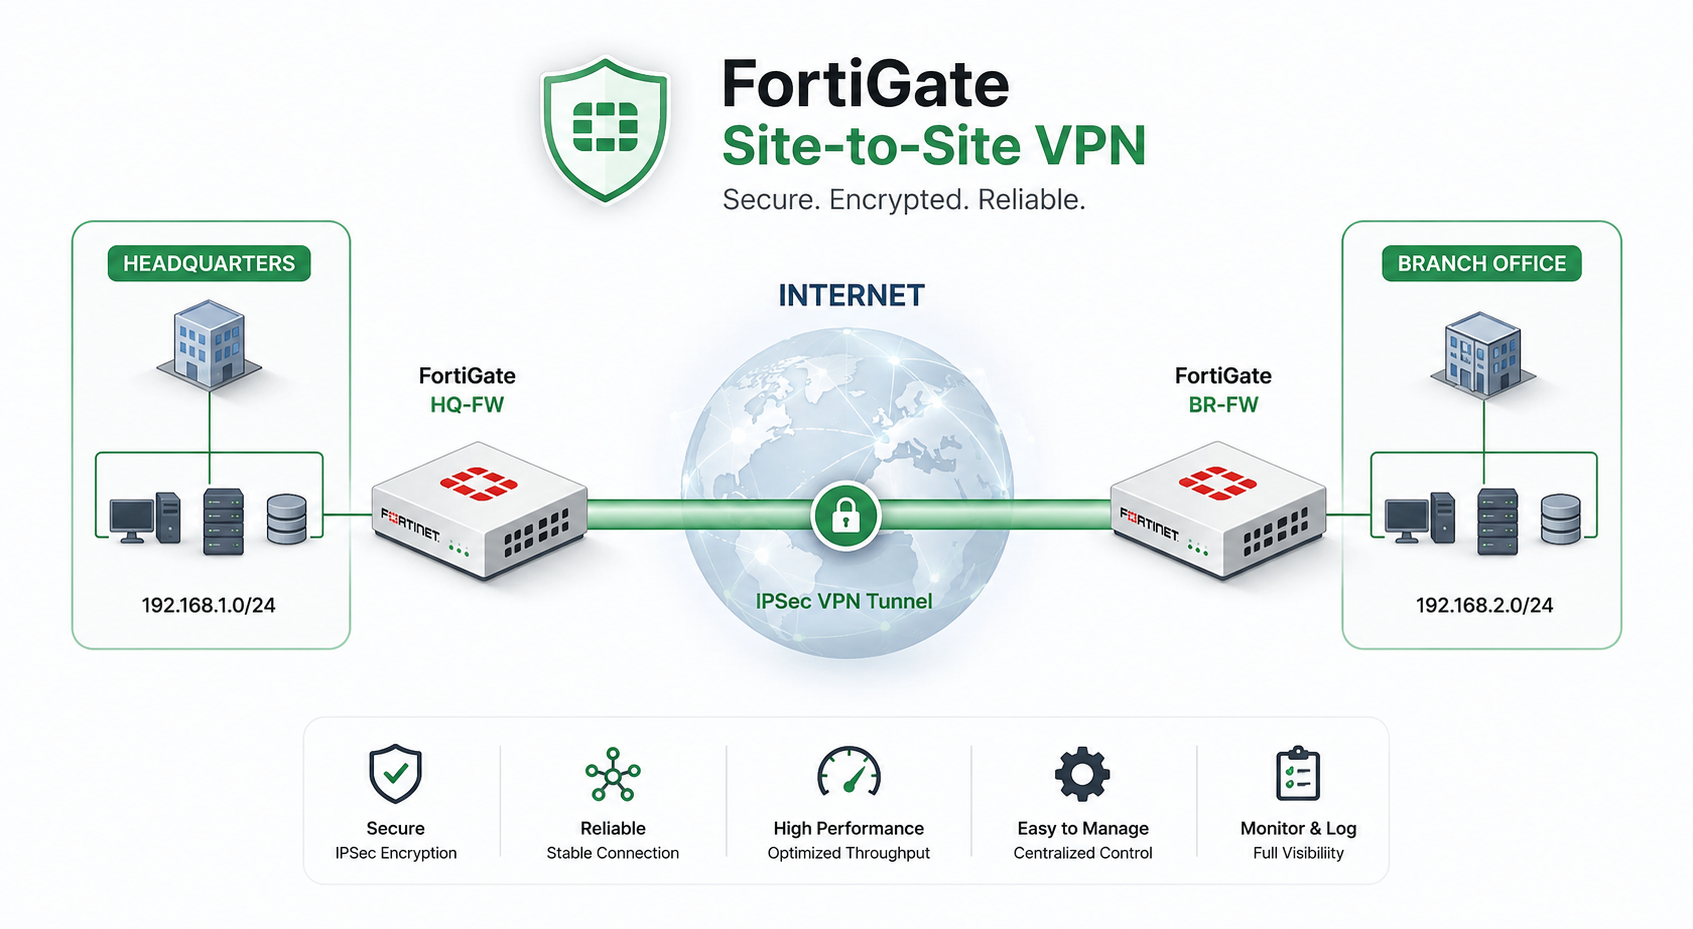
At its core, a Site-to-Site Virtual Private Network (VPN) acts as a secure, encrypted tunnel over the chaotic public internet. It allows two geographically separated corporate offices to communicate as if they were plugged into the exact same local switch. By encrypting the traffic before it leaves one firewall and decrypting it at the other, a VPN ensures that sensitive corporate data remains completely invisible and safe from eavesdropping or tampering while in transit.
When troubleshooting these tunnels on a FortiGate firewall, the GUI can only tell you so much. To truly isolate routing issues, verify hardware acceleration, or read negotiation failures, you must dive into the Command Line Interface (CLI).
Here is my personal field guide of the most critical FortiGate VPN diagnostic commands, what their outputs look like, and how to read them.
1. Routing & Tunnel Identification
Before diving into complex cryptography debugs, always ensure the firewall actually knows where to send the traffic and verify the high-level status of your tunnels.
Verify Routing: Check if the destination IP is actually being routed to your VPN tunnel interface.
get router info routing-table detail <destination-IP>Identify the Problematic Tunnel: If the destination is reachable by multiple tunnels, isolate which tunnel is failing by looking at the selectors and packet counters.
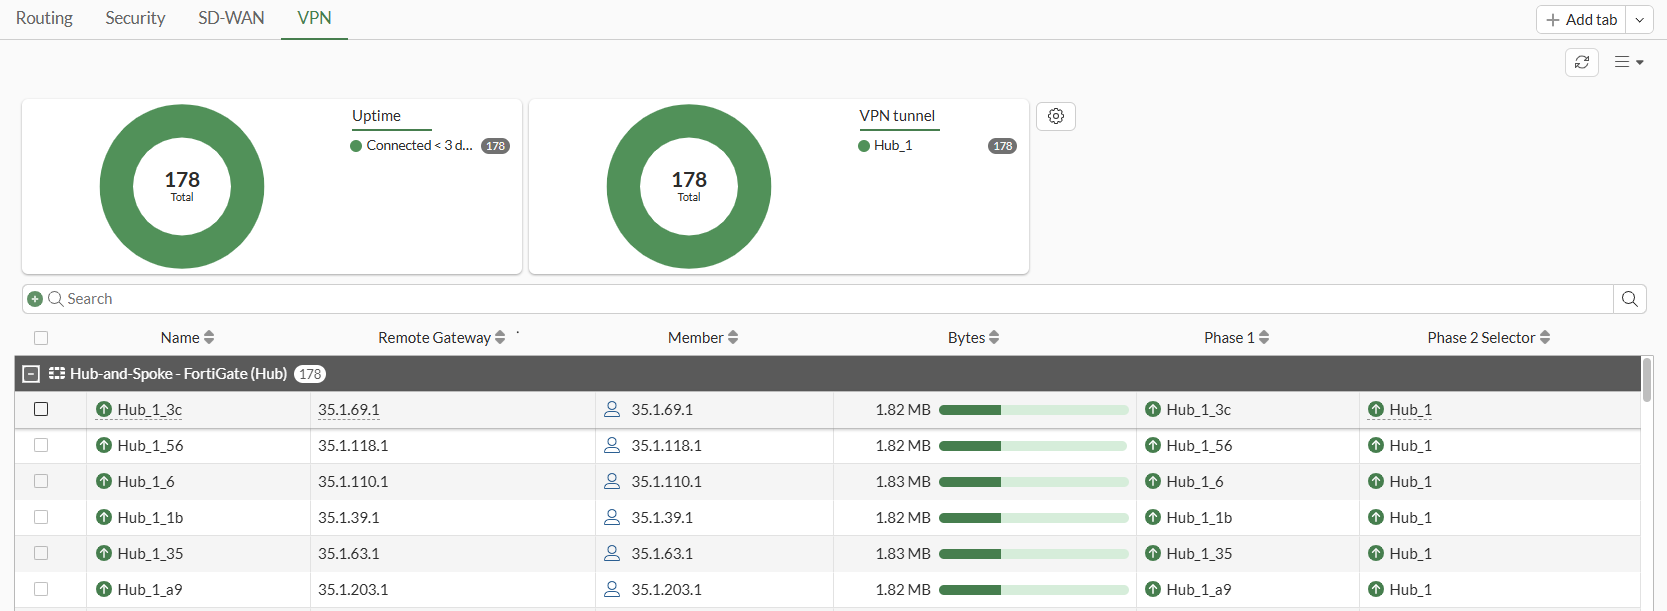
get vpn ipsec tunnel summary
'to10.174.0.182' 10.174.0.182:0  selectors(total,up): 1/1  rx(pkt,err): 1921/0  tx(pkt,err): 69/2
'to10.189.0.182' 10.189.0.182:0  selectors(total,up): 1/0  rx(pkt,err): 0/0  tx(pkt,err): 0/0
What to look for: In this output, the first tunnel is perfectly healthy
(selectors up: 1/1 and packets are moving). The second tunnel is down
(selectors up: 1/0 with zero traffic). Focus your troubleshooting on the second
tunnel.
2. Capturing IKE Packets (Packet Sniffer)
If the tunnel is down, you need to know if the two firewalls are even talking to each other. Running a packet capture on the negotiation ports is the fastest way to find out if an ISP is blocking your traffic.
When NAT is NOT used (Standard UDP 500):
diagnose sniffer packet <interface name> "host <remote gw> and udp port 500" 6 0 lWhen NAT is used (NAT-T enabled, checking UDP 500 and 4500):
diagnose sniffer packet any 'host <IPSec peer IP> and udp port 500 or udp port 4500' 4 0 l3. The Daemon Summary
Check the overall IKE daemon status to see how many tunnels are currently active versus how many were attempted.
diagnose vpn ike status
connection: 2/50
IKE SA: created 2/51  established 2/9  times 0/13/40 ms
IPsec SA: created 1/13  established 1/7  times 0/8/30 ms
What to look for: This gives you a quick health check of the entire firewall. If "created" is much higher than "established", you have multiple tunnels failing to negotiate.
4. Inspecting Phase 1 (IKE Gateway)
If packets are reaching the firewall but the tunnel is down, verify if Phase 1 (the secure control channel) is up.
diagnose vpn ike gateway list
vd: root/0
name: to_HQ
version: 1
interface: port13 42
addr: 173.1.1.1:500 -> 11.101.1.1:500
created: 1013s ago
assigned IPv4 address: 11.11.11.1/255.255.255.252
IKE SA: created 1/1  established 1/1  time 0/0/0 ms
IPsec SA: created 1/1  established 1/1  time 0/0/0 ms

  direction: initiator
  status: established 1013-1013s ago = 0ms
  proposal: aes128-sha256
  key: bb101b9127ed5844-1582fd614d5a8a33
  lifetime/rekey: 86400/85086
What to look for: Check the status (it should say 'established') and verify
the proposal (encryption/hash) matches what you expect. You can also see if the
FortiGate acted as the initiator or responder.
5. Inspecting Phase 2 (IPsec Tunnel)
If Phase 1 is established but traffic isn't flowing, we need to look at Phase 2 (the actual data tunnel).
diagnose vpn tunnel list
name=to_HQ ver=1 serial=7 173.1.1.1:0->11.101.1.1:0 tun_id=11.101.1.1
bound_if=42 lgwy=static/1 tun=intf/0 mode=auto/1 encap=none/8 options[0008]=npu
stat: rxp=1 txp=4 rxb=152 txb=336
dpd: mode=on-demand on=1 idle=20000ms retry=3 count=0 seqno=5
proxyid=to_HQ proto=0 sa=1 ref=2 serial=1
  src: 0:0.0.0.0/0.0.0.0:0
  dst: 0:0.0.0.0/0.0.0.0:0
  dec:pkts/bytes=1/84, enc:pkts/bytes=4/608
What to look for: The stat line shows Received Packets (rxp) and
Transmitted Packets (txp). If txp is increasing but rxp remains 0,
your traffic is leaving, but the remote side is either dropping it or routing it incorrectly.
Verify your src and dst proxy IDs (selectors) match the remote
firewall perfectly.
6. Hardware Acceleration (ASIC/NPU) Status
FortiGates use dedicated NPUs (Network Processors) to offload VPN encryption. If a high-throughput tunnel is causing high CPU usage, check if it's actually being offloaded to the hardware.
diagnose vpn ipsec status
NP6_1:
    Encryption (encrypted/decrypted)
        aes              : 337152           46069
SOFTWARE:
    Encryption (encrypted/decrypted)
        aes              : 0                 0.
What to look for: You want to see the counters increasing under NP6 or
CP8 (hardware chips). If counters are only increasing under the
SOFTWARE section, your traffic is bypassing the ASIC, which will cause severe
performance degradation under heavy load.
7. Real-Time Debugging (The Truth Teller)
When configurations look correct but the tunnel still fails to establish, you must read the live IKE negotiation process. Always use filters so you don't overwhelm the console with unrelated VPN traffic.
diagnose vpn ike log filter rem-addr4 11.101.1.1
diagnose debug application ike -1
diagnose debug enable
ike 0:to_HQ:101: initiator: aggressive mode is sending 1st message...
ike 0:to_HQ:101: peer identifier IPV4_ADDR 11.101.1.1
ike 0:to_HQ:101: proposal id = 1:
ike 0:to_HQ:101:    protocol id = ISAKMP:
ike 0:to_HQ:101:       type=OAKLEY_ENCRYPT_ALG, val=AES_CBC, key-len=128
ike 0:to_HQ:101:       type=OAKLEY_HASH_ALG, val=SHA2_256.
ike 0:to_HQ:101: PSK authentication succeeded
ike 0:to_HQ:101: established IKE SA dff03f1d4820222a/6c2caf4dcf5bab75
What to look for: This output reads like a story. It tells you exactly what algorithms are proposed, if NAT is detected, and if the Pre-Shared Key (PSK) authentication succeeds. If the tunnel is failing, the debug will explicitly state exactly why, such as "proposal mismatch" or "invalid PSK".
8. Flushing Security Associations (SAs)
Sometimes, after a configuration change or a connection glitch, an SA hangs. The fastest fix is to flush the tunnel to clear the old session and force a clean renegotiation.
diagnose vpn tunnel flush <tunnel-name>
ike V=root:0:ng-vpn-access_0: admin flush IPsec SAs
ike V=root:0:ng-vpn-access_0: deleting IPsec SA with SPI 4c04e46a
ike V=root:0:ng-vpn-access_0: sending SNMP tunnel DOWN trap