 Enes Guven
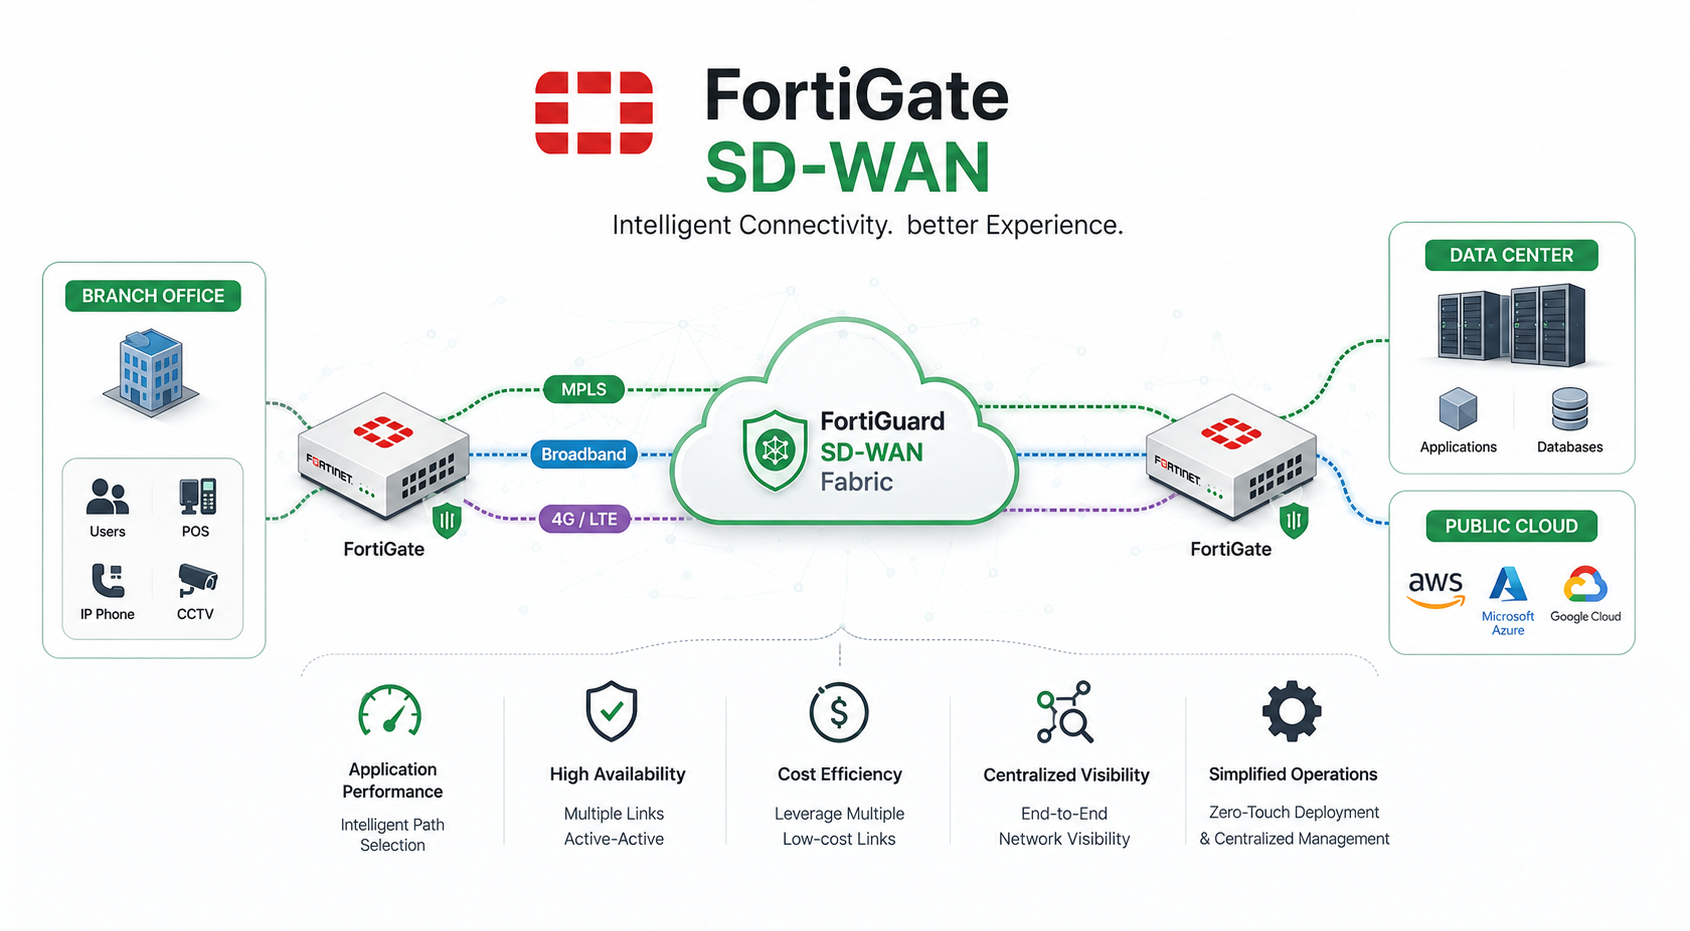
Historically, a traditional VPN creates a static, rigid tunnel between two points. If that path suffers from packet loss or high latency, the VPN stays up, but the user experience is ruined. SD-WAN (Software-Defined Wide Area Network) changes this paradigm.
Instead of relying on a single circuit, SD-WAN aggregates multiple physical connections (MPLS, Fiber Internet, LTE) into a single logical "fabric." It constantly monitors the health of every path and dynamically steers critical applications over the cleanest link in real-time. However, this intelligent abstraction makes troubleshooting much harder. When traffic takes an unexpected path, you must rely on the CLI to peel back the layers.
Below is my ultimate field guide for correlating your troubleshooting goals with the exact FortiOS commands required to expose the truth.
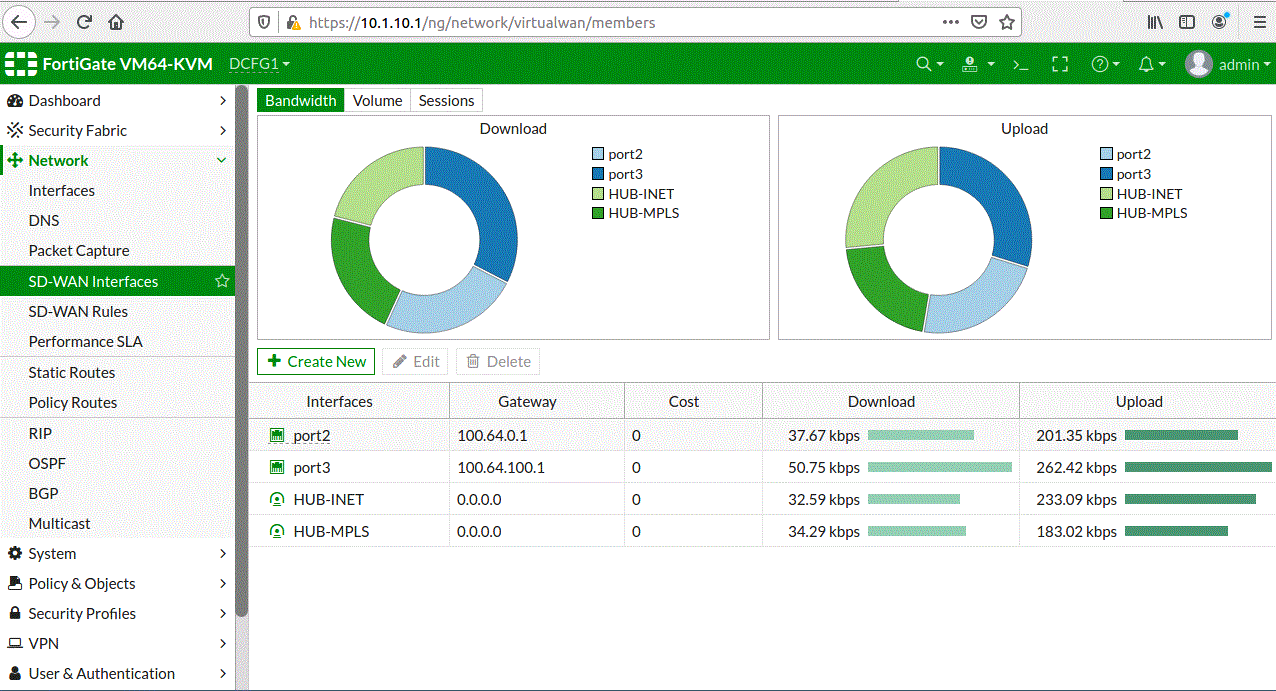
1. SLA, Link Monitor, and Probe Diagnostics
When a Performance SLA appears unhealthy but the SD-WAN abstraction alone does not explain why, you need to dive into the link-monitor daemon.
diagnose sys link-monitor status
diagnose sys link-monitor statusInterpretation: Use this output to confirm that the expected monitor exists and is updating. If the path is not listed or does not update, verify the health-check configuration and probe target reachability. Escalate to the interface-specific command for per-member details.
diagnose sys link-monitor interface
diagnose sys link-monitor interface HUB2-VPN1-1
Interface (HUB2-VPN1-1): state (up, since Sat May 17 11:36:45 2025), bandwidth (up:1507bps, down:1533bps), session count (IPv4:3, IPv6:0), tx (11302622 bytes), rx (246600 bytes), latency (0.50), jitter (0.06), packet-loss (0.00).
Interpretation: Low latency, low jitter, and near-zero packet loss indicate that
the monitored path is healthy. Packet loss or latency above the configured threshold explains
why the member may not be selected. If the interface looks healthy here but the member is not
selected, inspect diagnose sys sdwan service4 next.
diagnose debug application link-monitor -1
diagnose debug reset
diagnose debug console timestamp enable
diagnose debug application link-monitor -1
diagnose debug enable
Interpretation: Use timestamps to correlate debug lines with logs and probe interval settings. When probe send activity is present but replies are missing, confirm return-path routing and upstream reachability.
2. SD-WAN Rule & Policy Validation
diagnose sys sdwan service4
diagnose sys sdwan service4 1
Service(1): Address Mode(IPV4) flags=0x4200 use-shortcut-sla use-shortcut
 Tie break: cfg
 Shortcut priority: 2
  Gen(6), TOS(0x0/0x0), Protocol(0): src(1->65535):dst(1->65535), Mode(priority), link-cost-factor(latency), link-cost-threshold(10), heath-check(Internet)
  Service role: standalone
  Members(2):
    1: Seq_num(1 port1 WAN1), alive, latency: 19.439, selected
    2: Seq_num(2 port2 WAN2), alive, latency: 24.456, selected
  Application Control(3): Salesforce(16920,0) Microsoft.Teams(43541,0) Dropbox(17459,0)
  Src address(1):
        10.1.0.0-10.1.255.255
Interpretation: Only alive members are considered. Selected member = actual forwarding path. With multiple selected members, the order listed indicates priority.
diagnose ip proute match
diagnose ip proute match 208.91.114.181 172.31.134.1 port3 6 443
dst=208.91.114.181 src=172.31.134.1 smac=00:00:00:00:00:00 iif=5 protocol=6 dport=443 id=00000002 type=Policy Route seq-num=2
Interpretation: The returned ID identifies the matching rule. SD-WAN rules and ISDB policy-routes use IDs above 65535, while regular policy-routes use lower IDs.
diagnose firewall proute list
diagnose firewall proute list
id=2130706433(0x7f000001) vwl_service=1(Critical_DIA) vwl_mbr_seq=1 2 dscp_tag=0xfc 0xfc flags=0x0 tos=0x00 tos_mask=0x00 protocol=0 port=src(0->0):dst(0->0) iif=0(any)
path(2): oif=3(port1), oif=4(port2)
source(1): 10.1.0.0-10.1.255.255
destination wildcard(1): 0.0.0.0/0.0.0.0
application control(3): Salesforce(16920,0) Microsoft.Teams(43541,0) Dropbox(17459,0)
hit_count=0 rule_last_used=2026-05-22 11:32:33
Interpretation: vwl_service corresponds to the SD-WAN rule ID.
oif is the selected egress interface.
diagnose sys sdwan internet-service-app-ctrl-list
diagnose sys sdwan internet-service-app-ctrl-list
List App Ctrl Database Entry(IPv4) in Kernel:
Max_App_Ctrl_Size=32768 Num_App_Ctrl_Entry=68
Microsoft.Portal(41469 28): IP=173.223.146.43 6 80 expires=2805047ms
Microsoft.Portal(41469 28): IP=204.79.197.212 6 80 expires=2803413ms
Microsoft.365.Portal(41468 28): IP=13.107.6.156 6 80 expires=2800214ms
Interpretation: If this list is empty, there is no application learning occurring, and your application-based rule will never match.
diagnose netlink dstmac list
diagnose netlink dstmac list R150
dev=R150 mac=00:00:00:00:00:00 vwl rx_tcp_mss=0 tx_tcp_mss=0 egress_overspill_threshold=50000 egress_bytes=100982 egress_over_bps=1 ingress_overspill_threshold=37500 ingress_bytes=40 ingress_over_bps=0 sampler_rate=0 vwl_zone_id=1 intf_qua=0
Interpretation: egress_over_bps=1 or
ingress_over_bps=1 indicates that the configured threshold has been exceeded.
Correlate this with member status when traffic distribution doesn't match expectations.
3. Session Filter Refinements
diagnose sys session filter clear
diagnose sys session filter src 10.61.2.39
diagnose sys session filter dst 8.8.8.8
diagnose sys session filter proto 1
diagnose sys session list
Interpretation: Always run filter clear before setting new
filters so you avoid misreading the table due to old criteria. Use protocol 1 for ICMP, 6 for
TCP, and 17 for UDP. After filtering, inspect sdwan_service_id and
sdwan_mbr_seq in the session entry.
4. Routing Validation (RIB vs FIB)
get router info routing-table all
get router info routing-table all
Codes: K - kernel, C - connected, S - static, B - BGP, O - OSPF
S* 0.0.0.0/0 [10/0] via 192.168.183.254, port1
C 10.0.0.0/24 is directly connected, VLAN_on_port1
Interpretation: If the expected route is missing, troubleshoot the routing
source before focusing on SD-WAN rule logic. To identify suppressed or less-preferred routes,
use get router info routing-table database.
get router info kernel / diagnose ip route list
get router info kernel
diagnose ip route list
Interpretation: If the route exists in the RIB but not in the FIB, investigate
route installation or recursive resolution. Use diagnose ip route list when
validating the exact forwarding path chosen by the device.
5. Advanced SD-WAN Debugging
diagnose debug reset
diagnose debug application sdwan -1
diagnose debug enable
Interpretation: Use with extreme care on busy systems and apply only during
focused troubleshooting windows. When rule evaluation still looks ambiguous, correlate these
logs with diagnose sys sdwan service4.